Selected work06of 09
Financial Research Hub
- Status
- Live demo
- Repo
- Private
01 What it is
A stock research site built around a personal watchlist. For each stock it shows the price history, a score for how good a buying opportunity it looks, a valuation that helps judge the right time to buy, upcoming events, and news.
02 The problem
Deciding whether a stock is worth buying after a fall means checking upcoming events, the company’s finances, the price chart, and what other investors are doing. That information sits on different sites.
03 How it works
The app is built around one approach: buy a stock after its price has fallen a long way. Each screen covers one part of that decision: how far it has fallen, what it is worth, whether the selling is ending, and what is coming up.
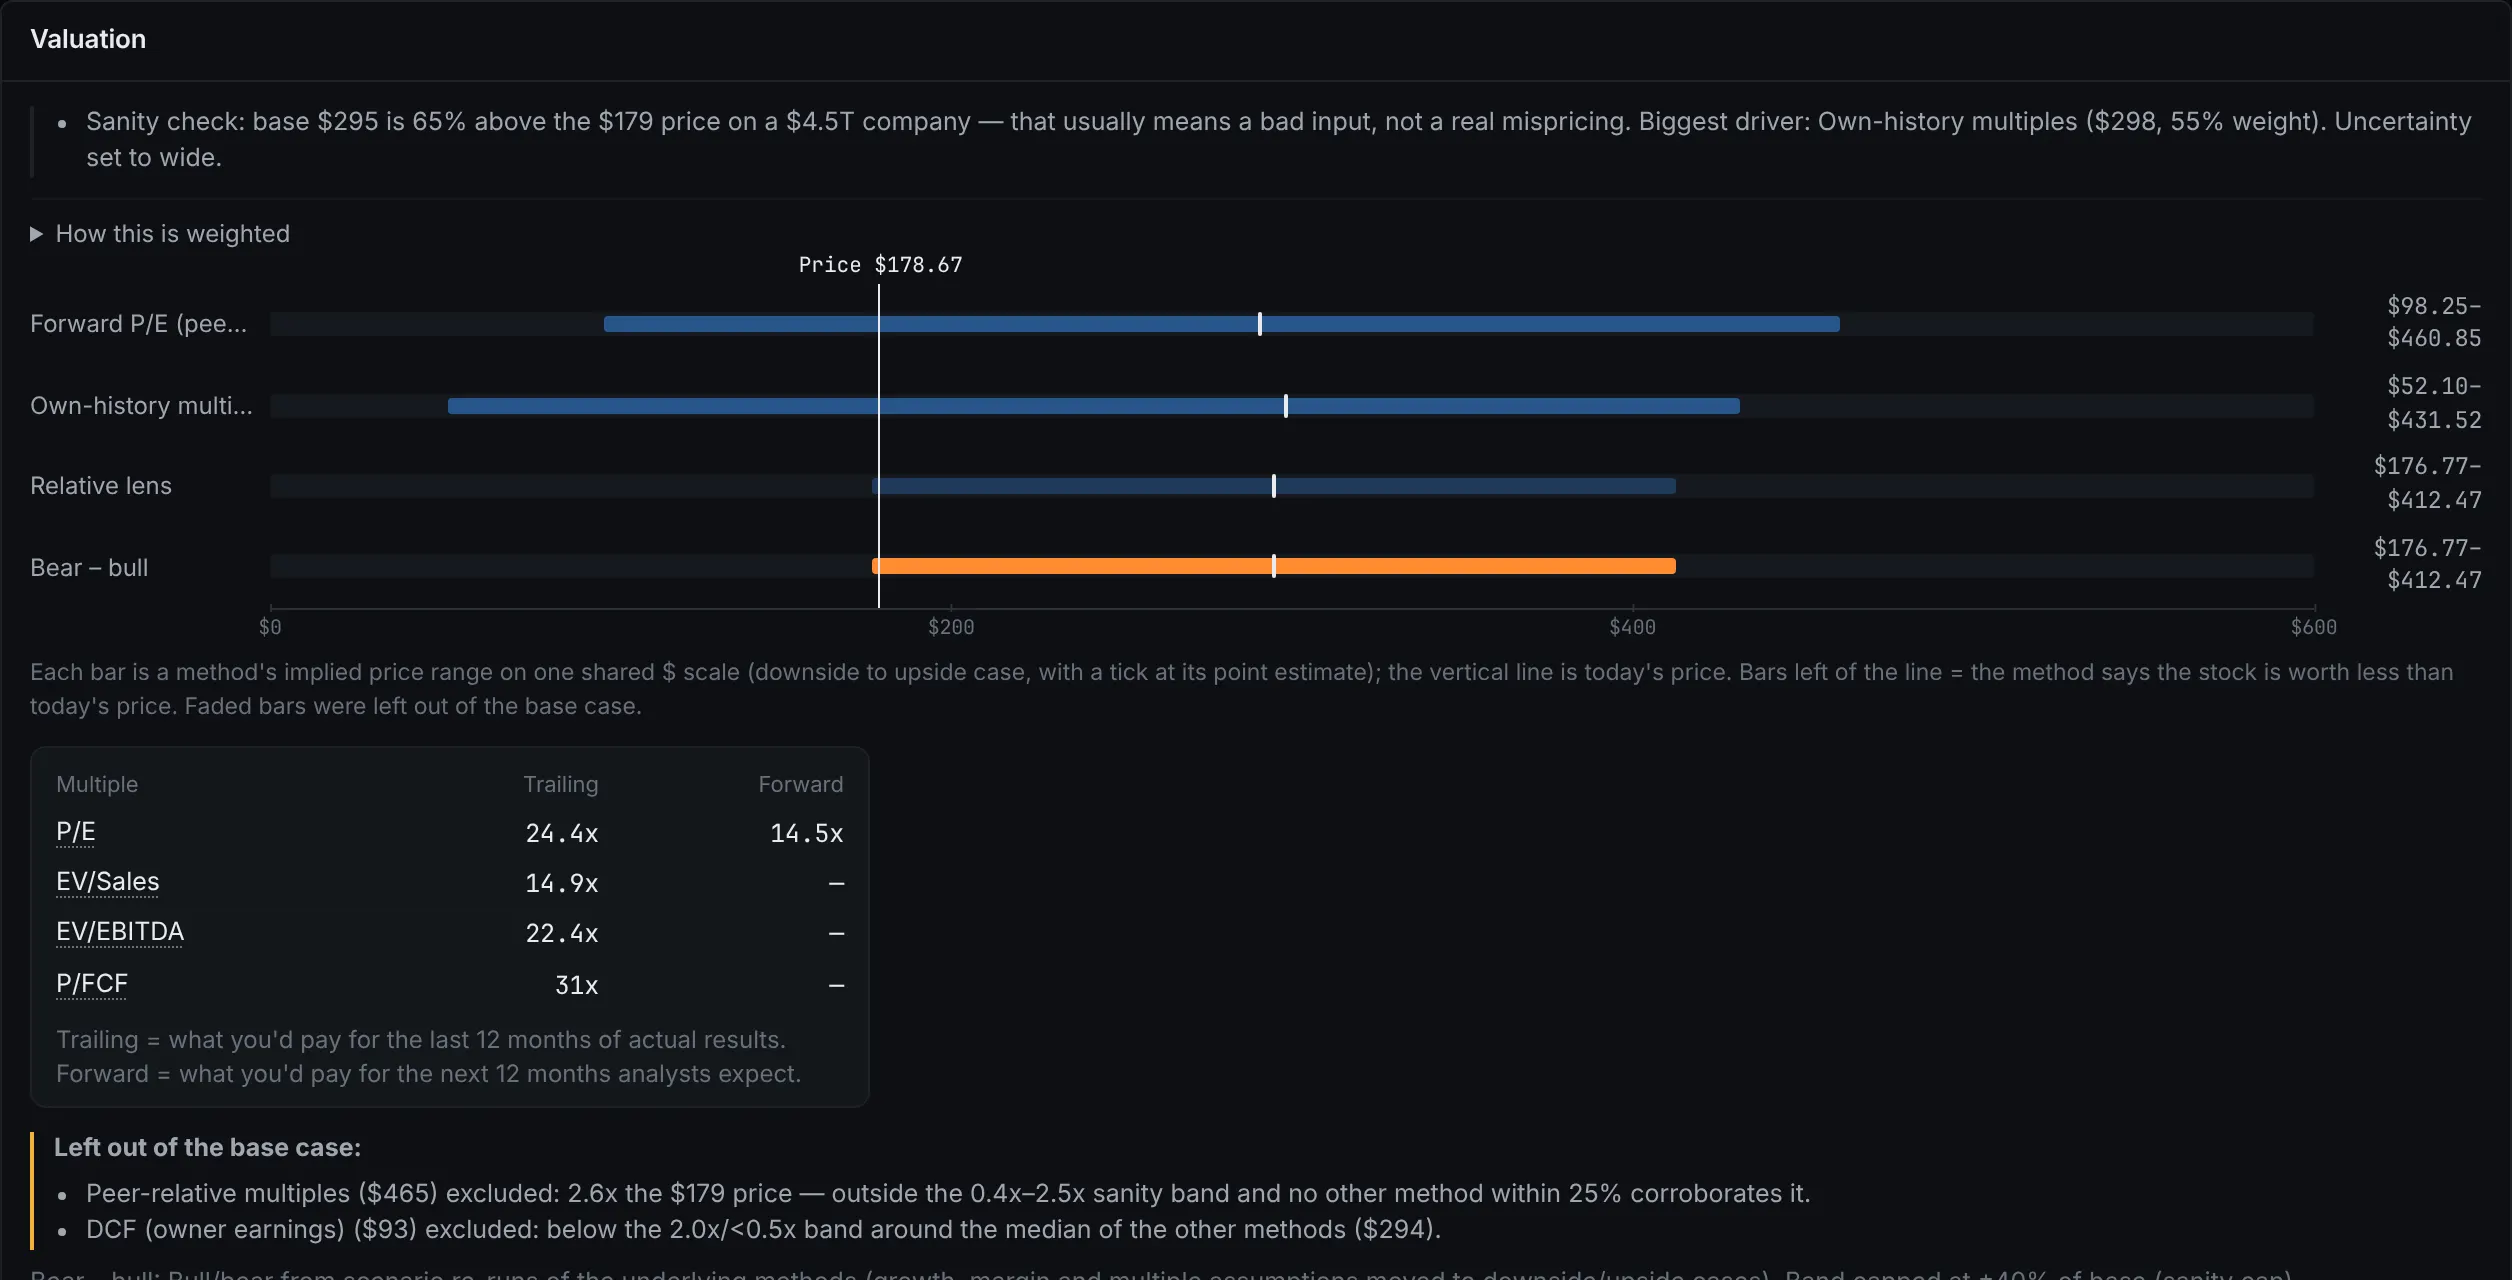
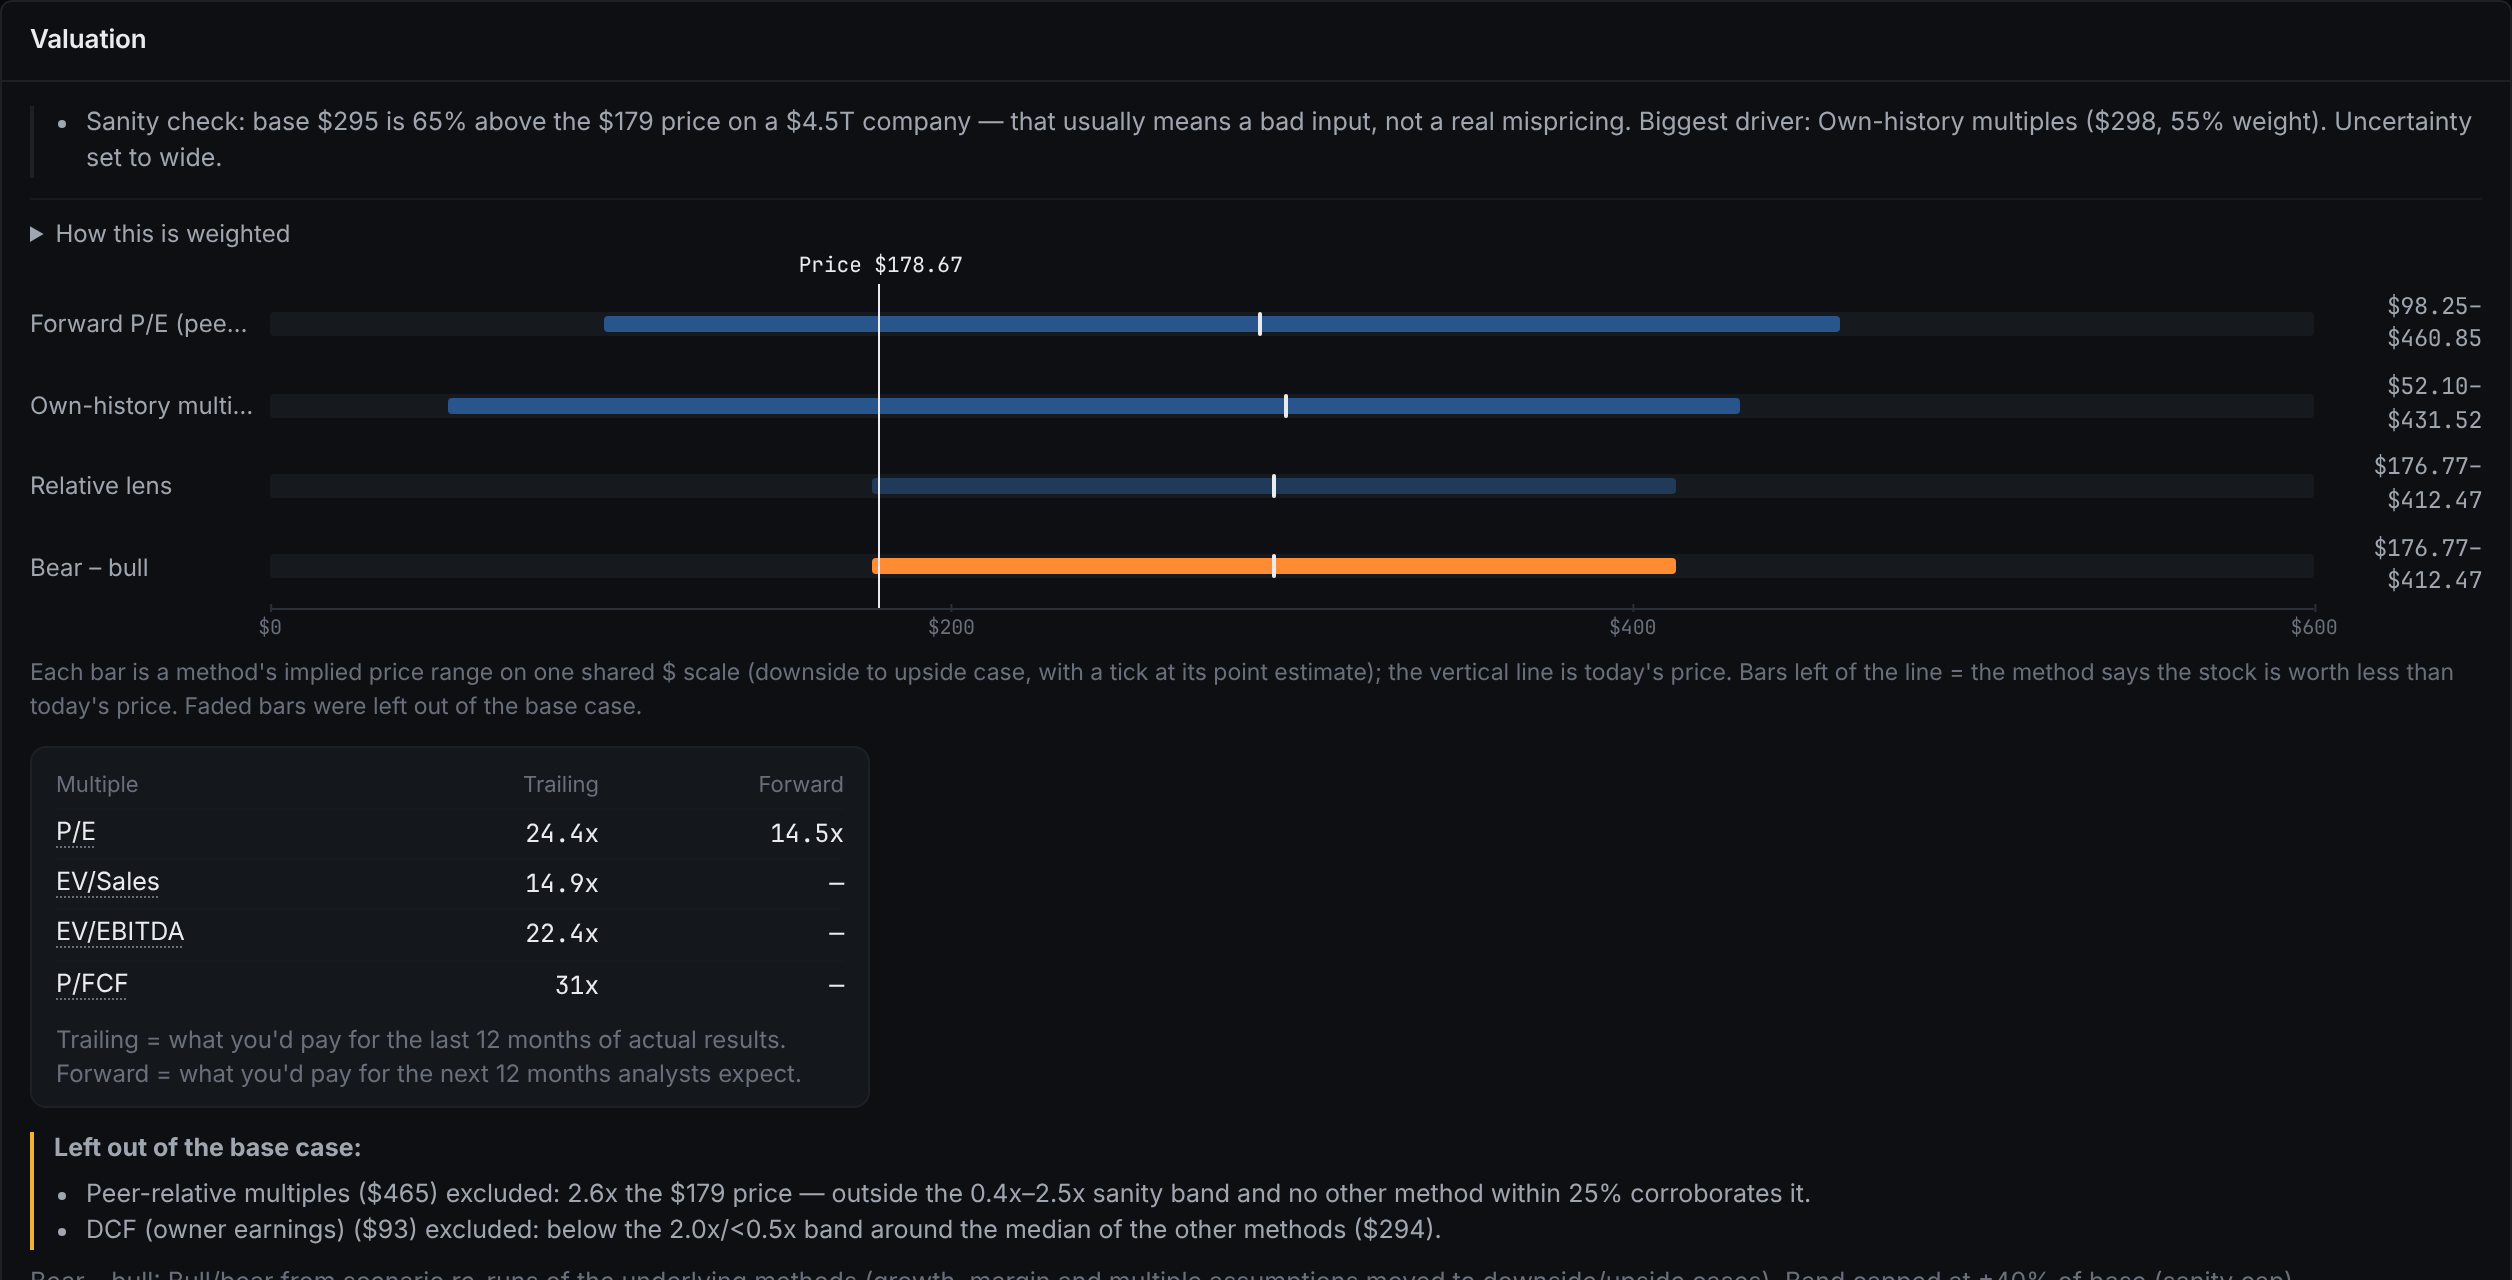
Fair value is never a single number. Four methods each give a price range, the app blends them into a base case with a high and a low case, and it shows which methods it left out.
A data pipeline runs on GitHub Actions. It fetches prices and company data, computes every score and valuation, and writes the results to files that the site reads. A Refresh button starts a new run.
04 What it does
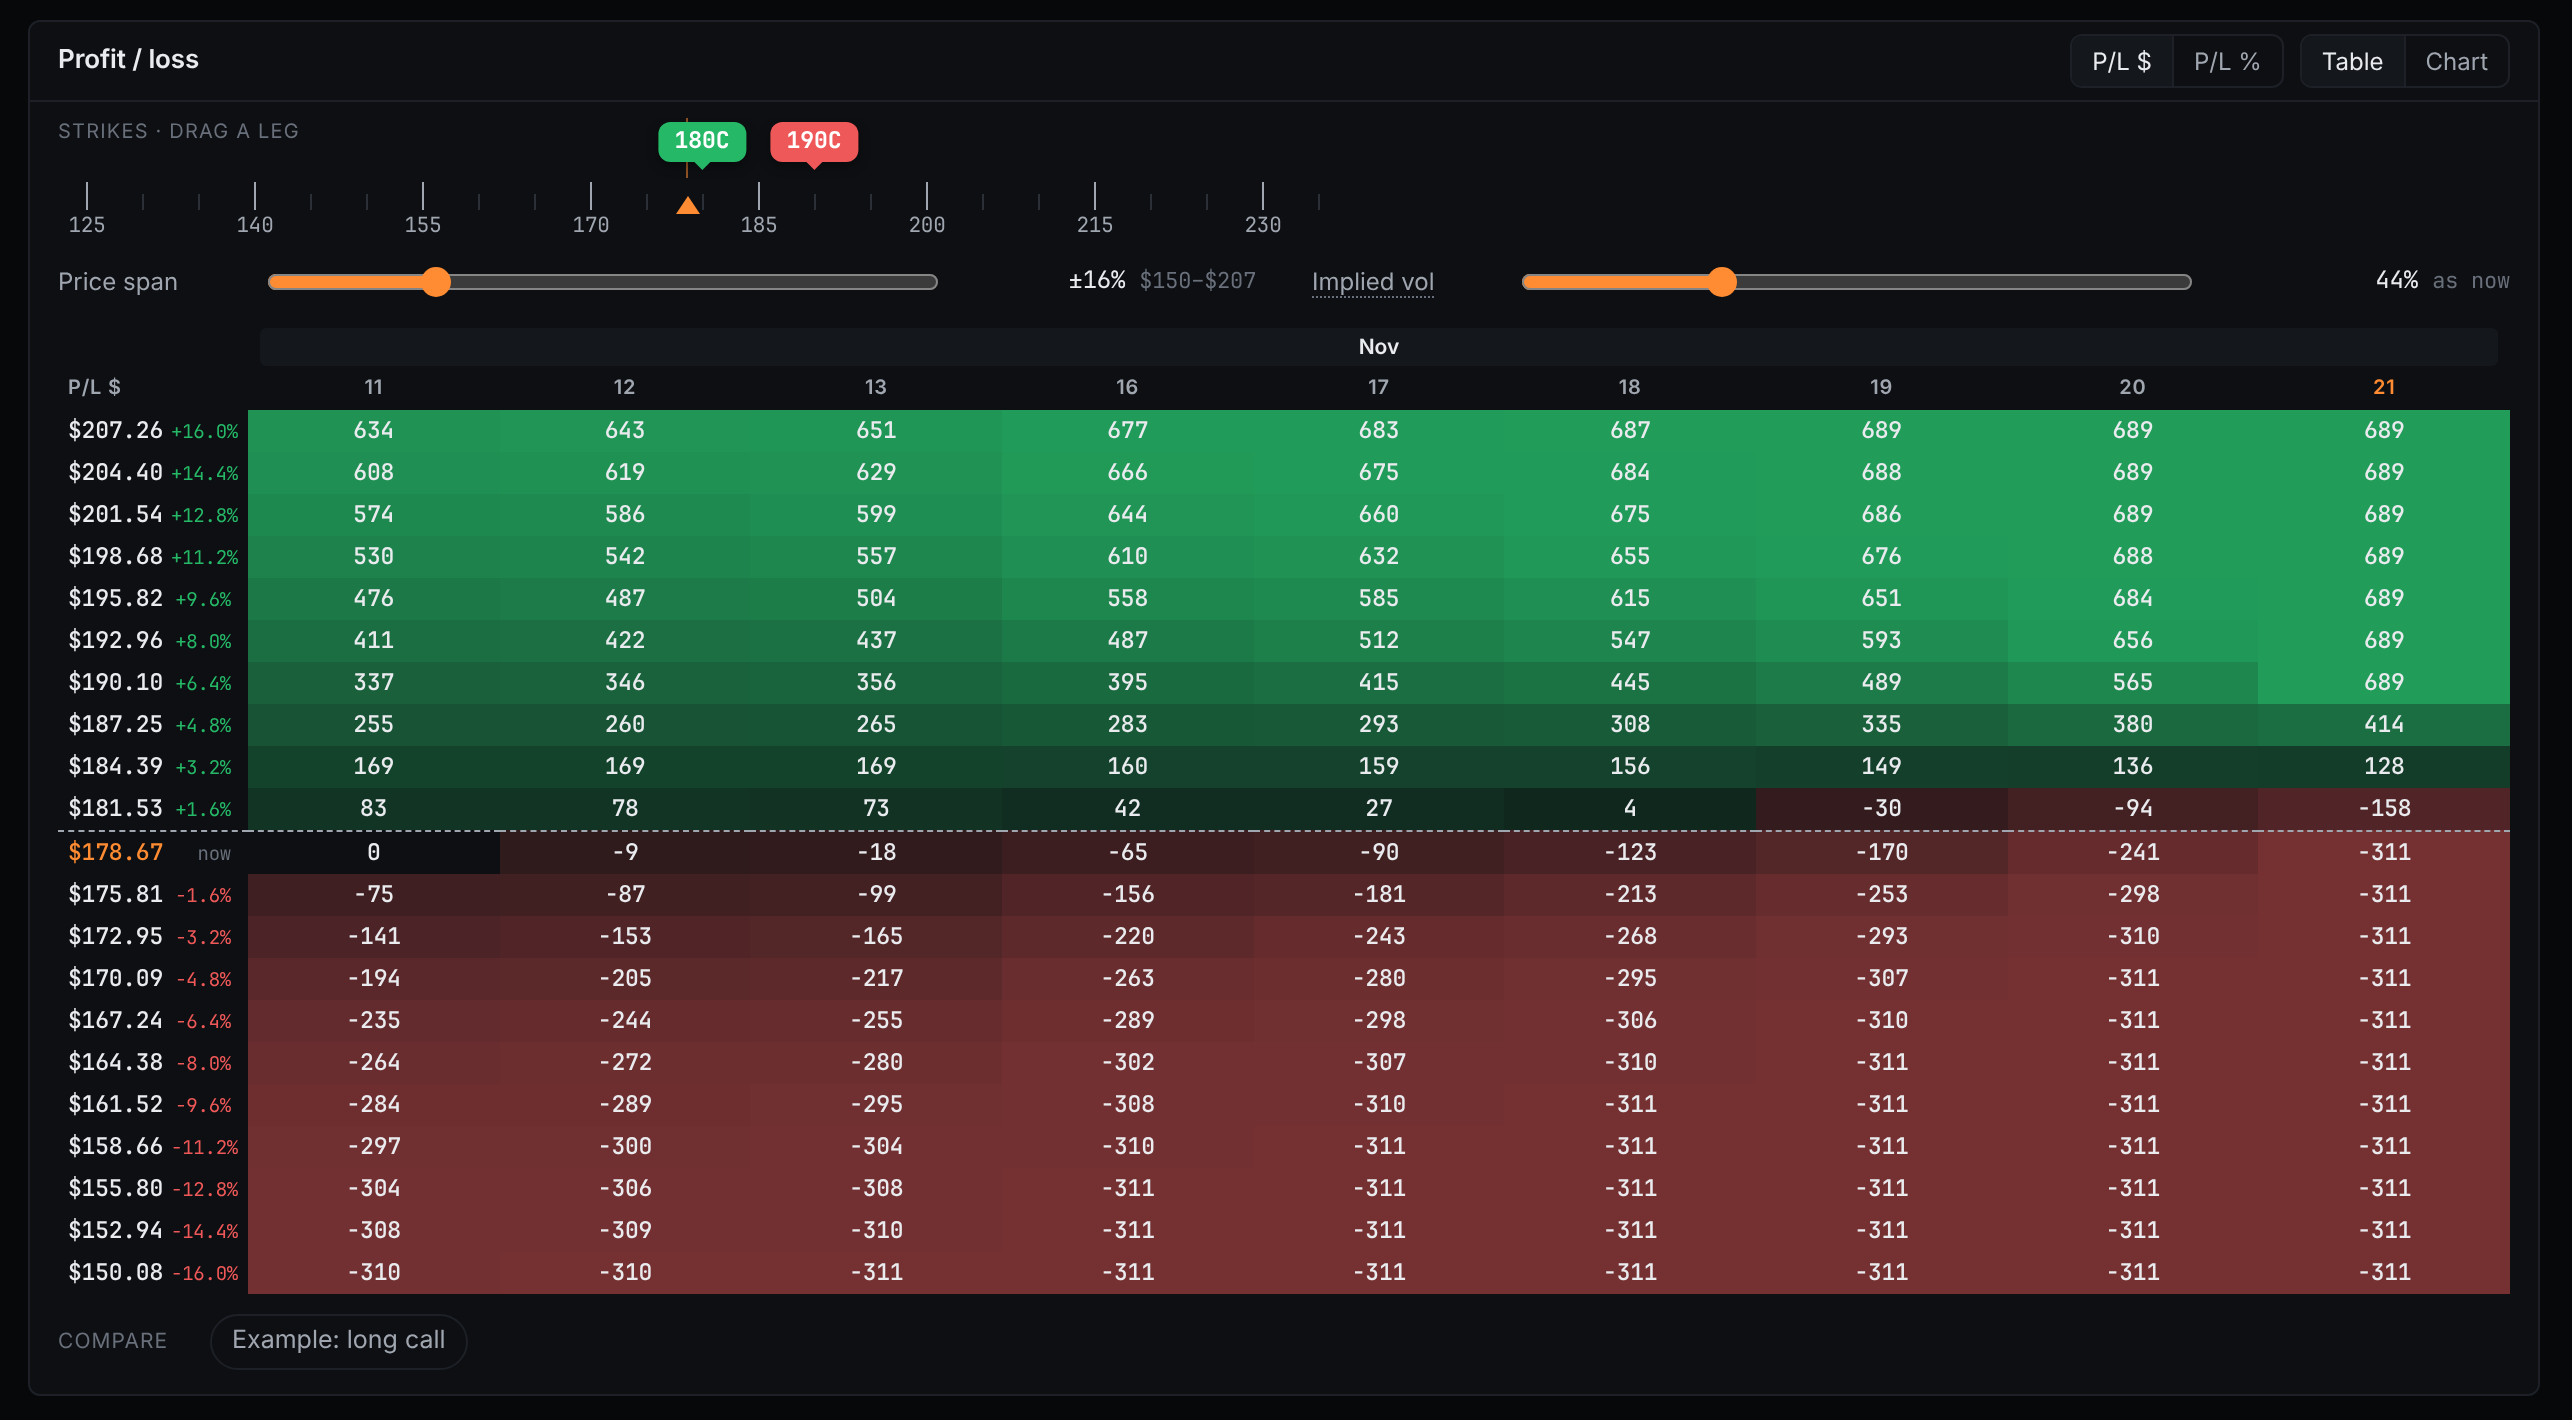
The three screenshots are from the public demo: market data is a snapshot from Nov 9, 2026, and option prices are modeled.
01
Watchlist
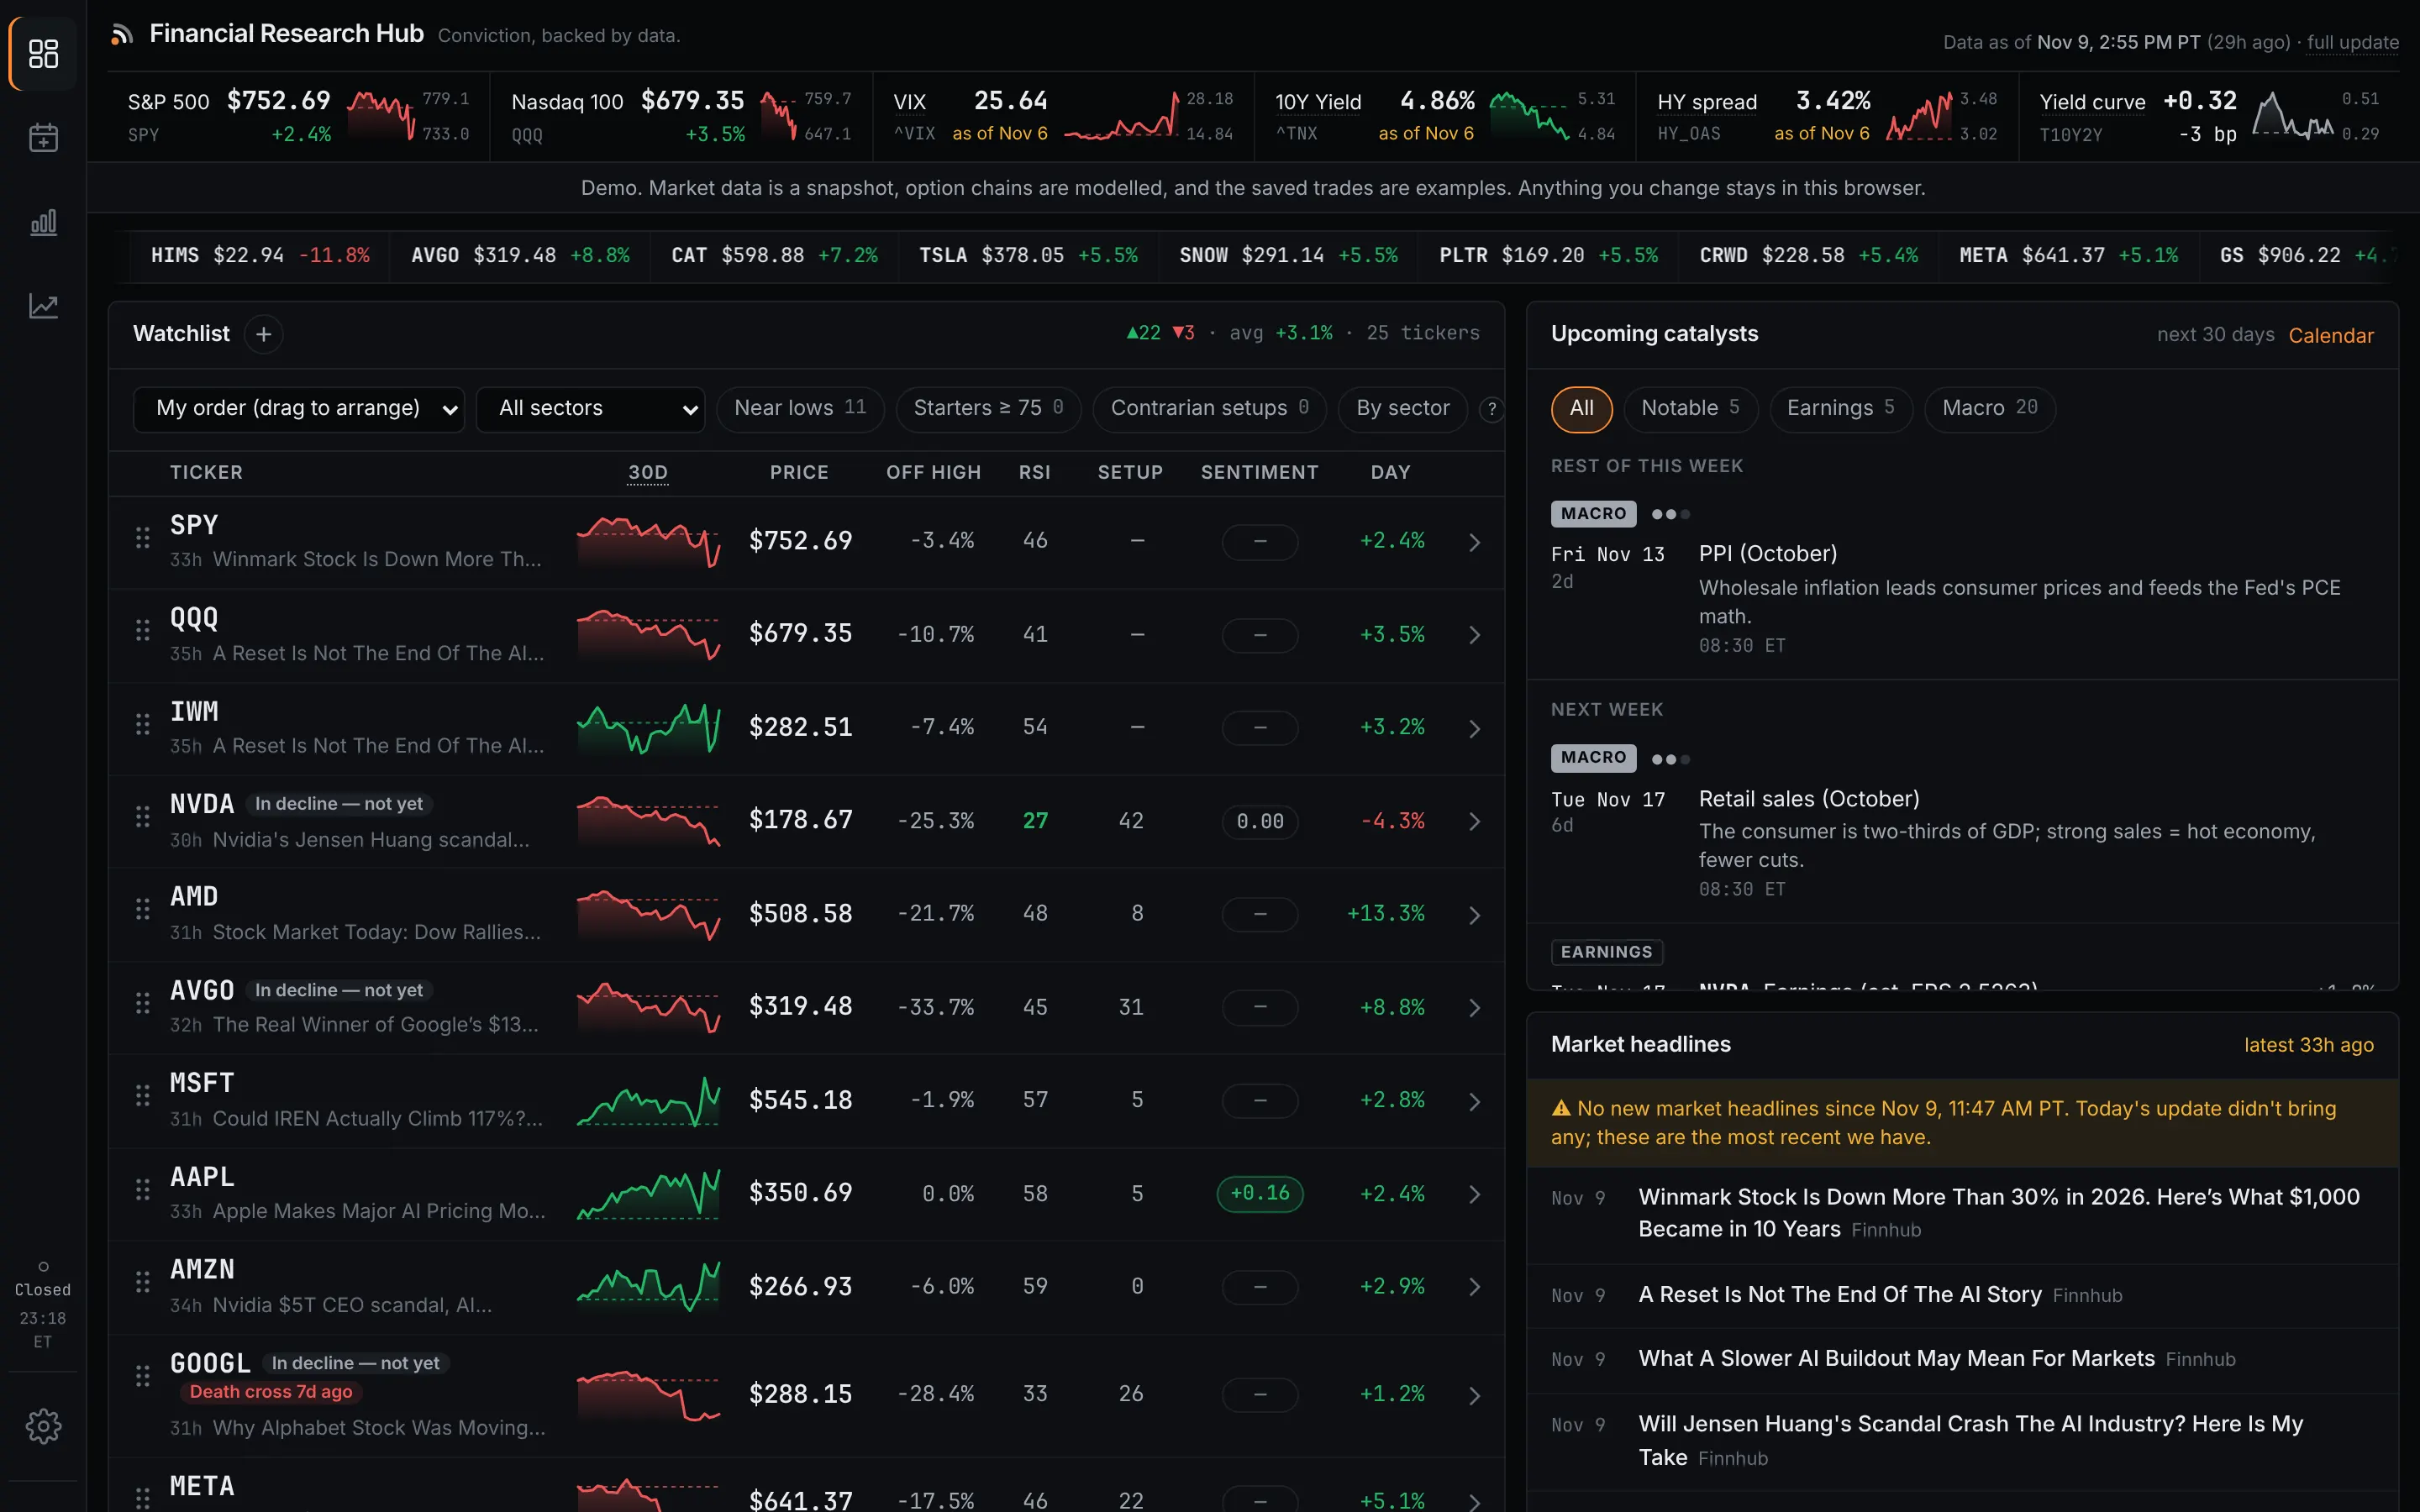
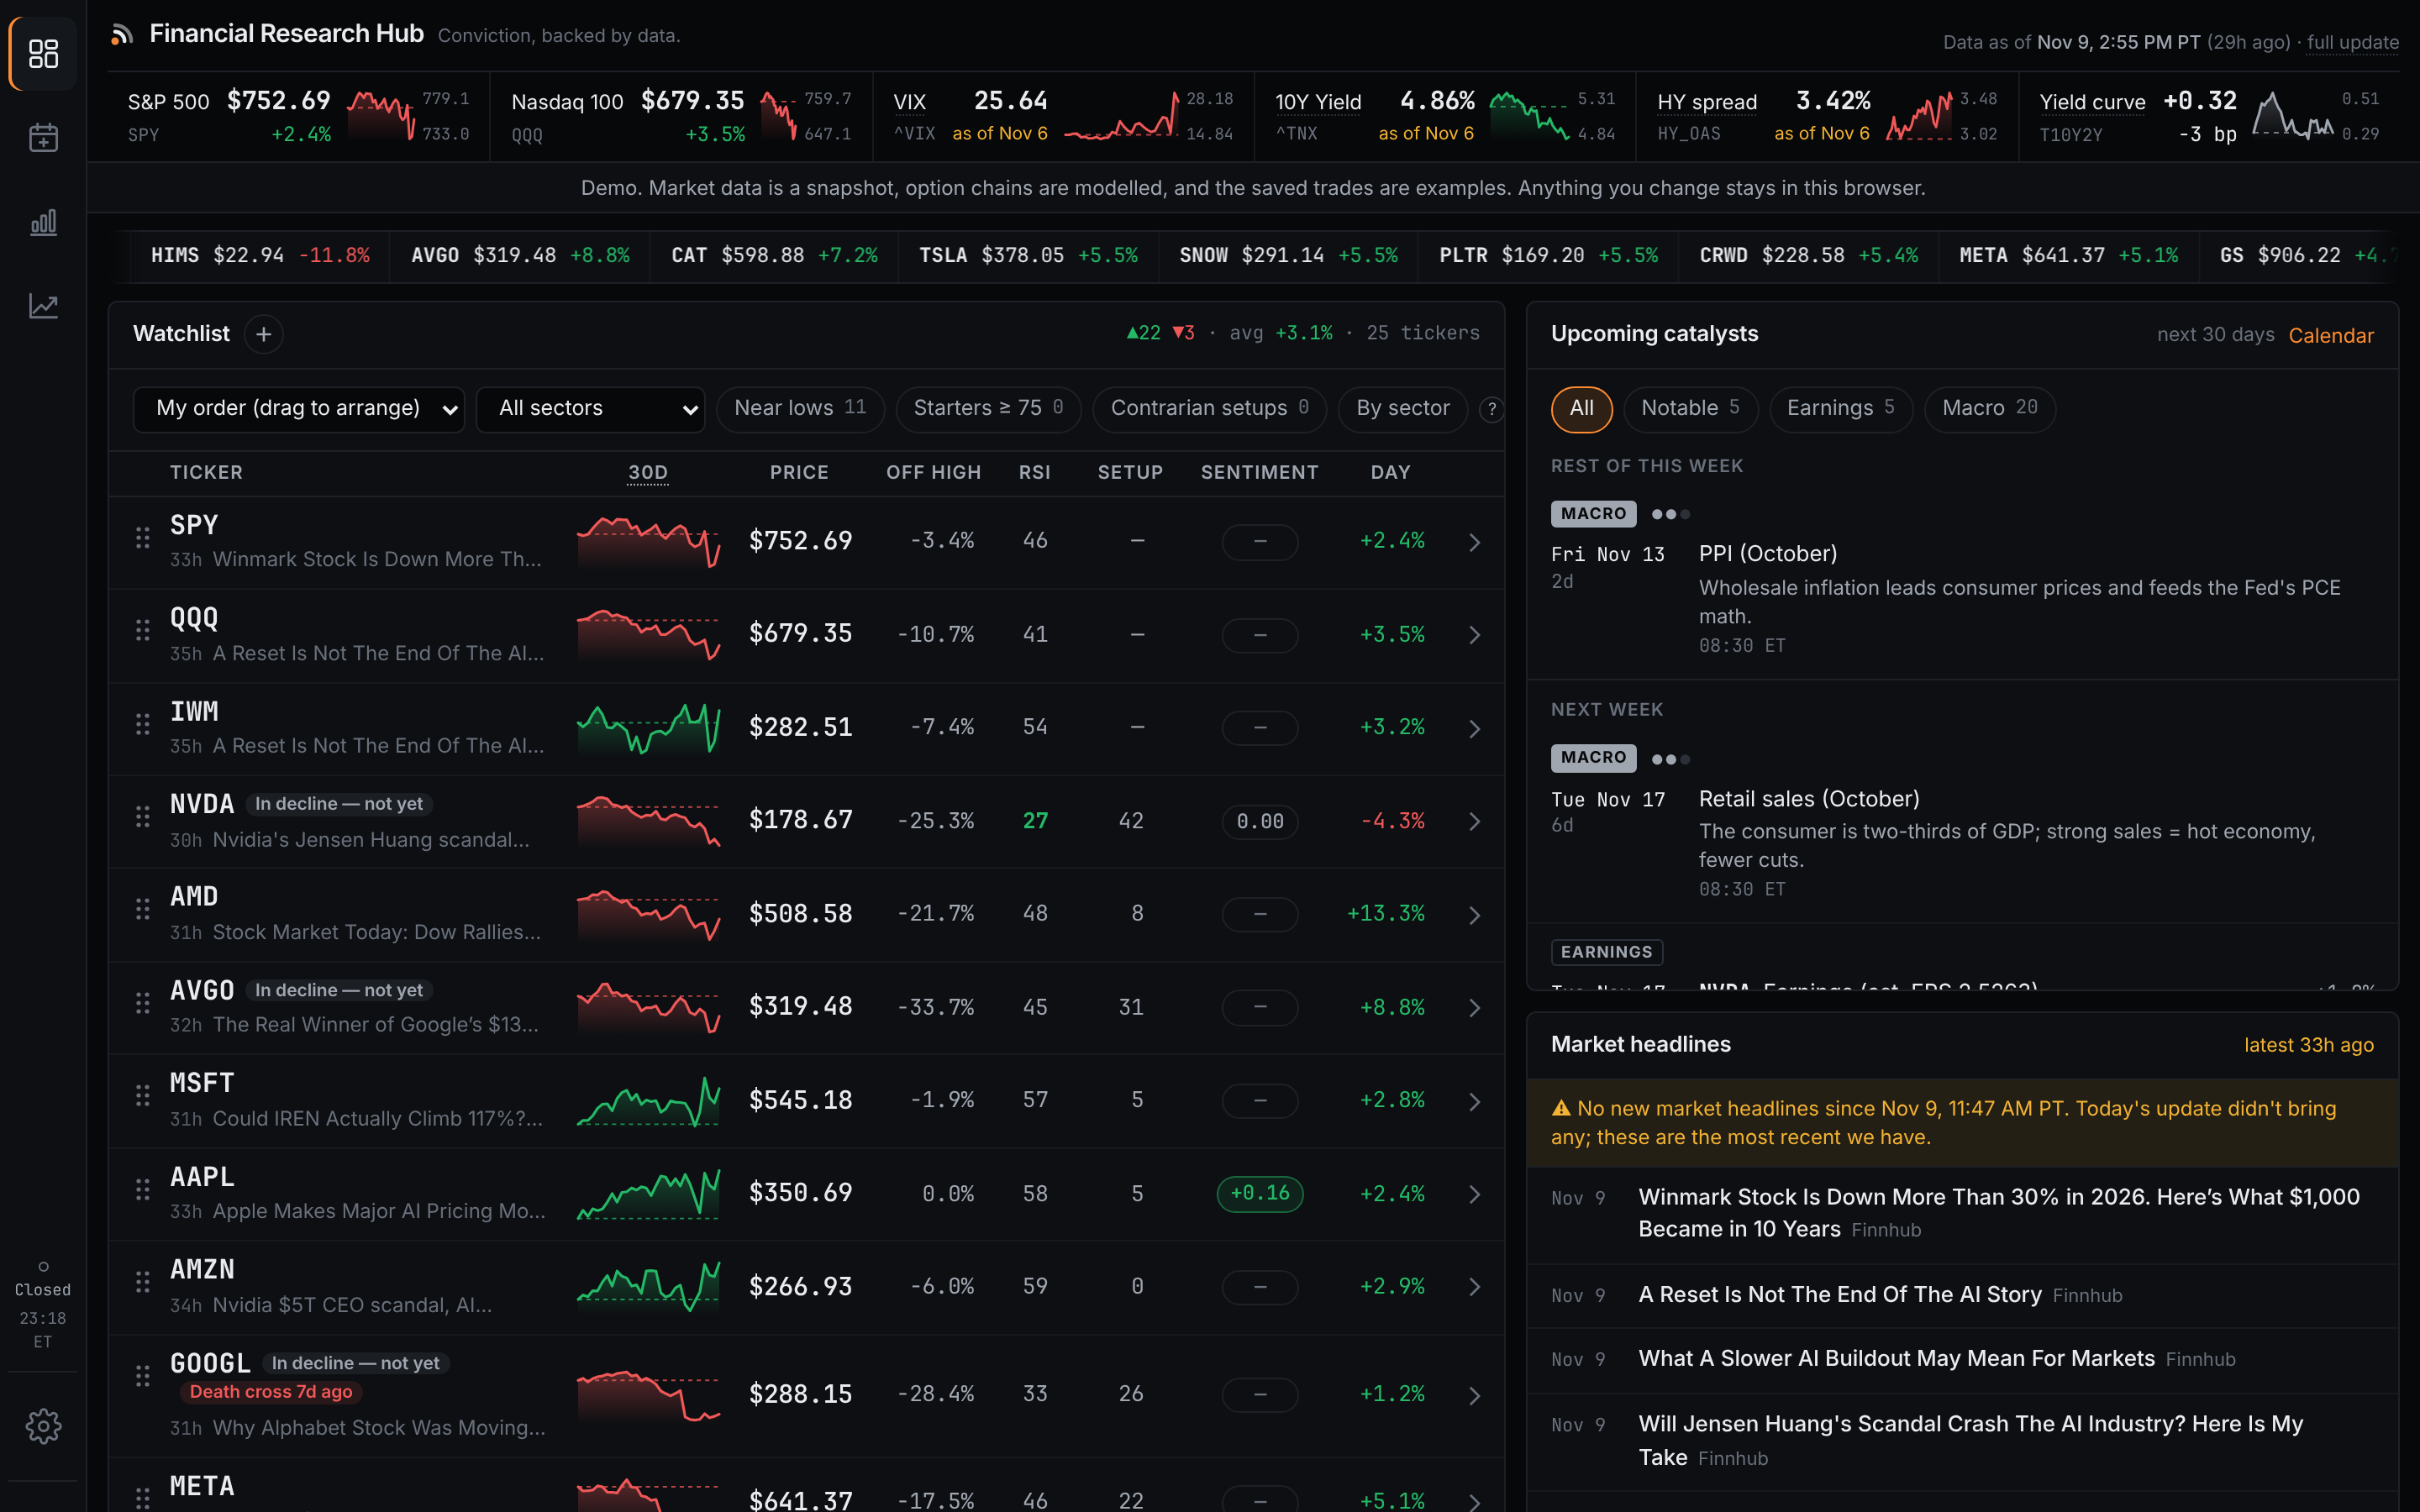
Every stock you follow in one table: price, 30-day trend, distance from the 52-week high, RSI, setup score, sentiment, and the day’s move. Sort, filter, and group by sector.
02
Setup score
A 0 to 100 score for how closely a stock matches a “buy near the lows” checklist, broken down rule by rule, with warnings for upcoming earnings and for stocks still falling.
03
Price chart
Candles or a line, with 50-day and 200-day averages, the 52-week range, volume, RSI, and the fair value range drawn on the same chart.
04
Sentiment and the contrarian read
Short interest, insider buying and selling, the put/call ratio, and news sentiment, combined into a three-stage read of whether the selling is ending.
05
Fair value
Four valuation methods, each shown as a price range against today’s price and blended into a base case with bull and bear cases. The gap to today’s price helps judge the right time to buy.
06
Catalyst calendar
Earnings, economic releases, and notable company events by month, each with a note on why it matters.
07
Economy
Inflation, jobs, growth, rates, recession risk, and market stress from Federal Reserve data, each with a plain label and what it means for buying now.
08
Glossary
Every term in the app has a plain-language definition, one tap away.
09
Option chain
Every expiration and strike with prices, volume, open interest, and implied volatility, plus a table of unusual activity ranked by premium.
10
Strategy builder
Pick a strategy or build one leg by leg. The builder shows the cost, maximum profit, maximum loss, breakeven, and chance of profit.
11
Trade tracker
Save a trade placed at a broker and track its profit and loss since entry, current value, breakeven, and days left, with alerts at a chosen gain or loss.
12
Profit and loss table
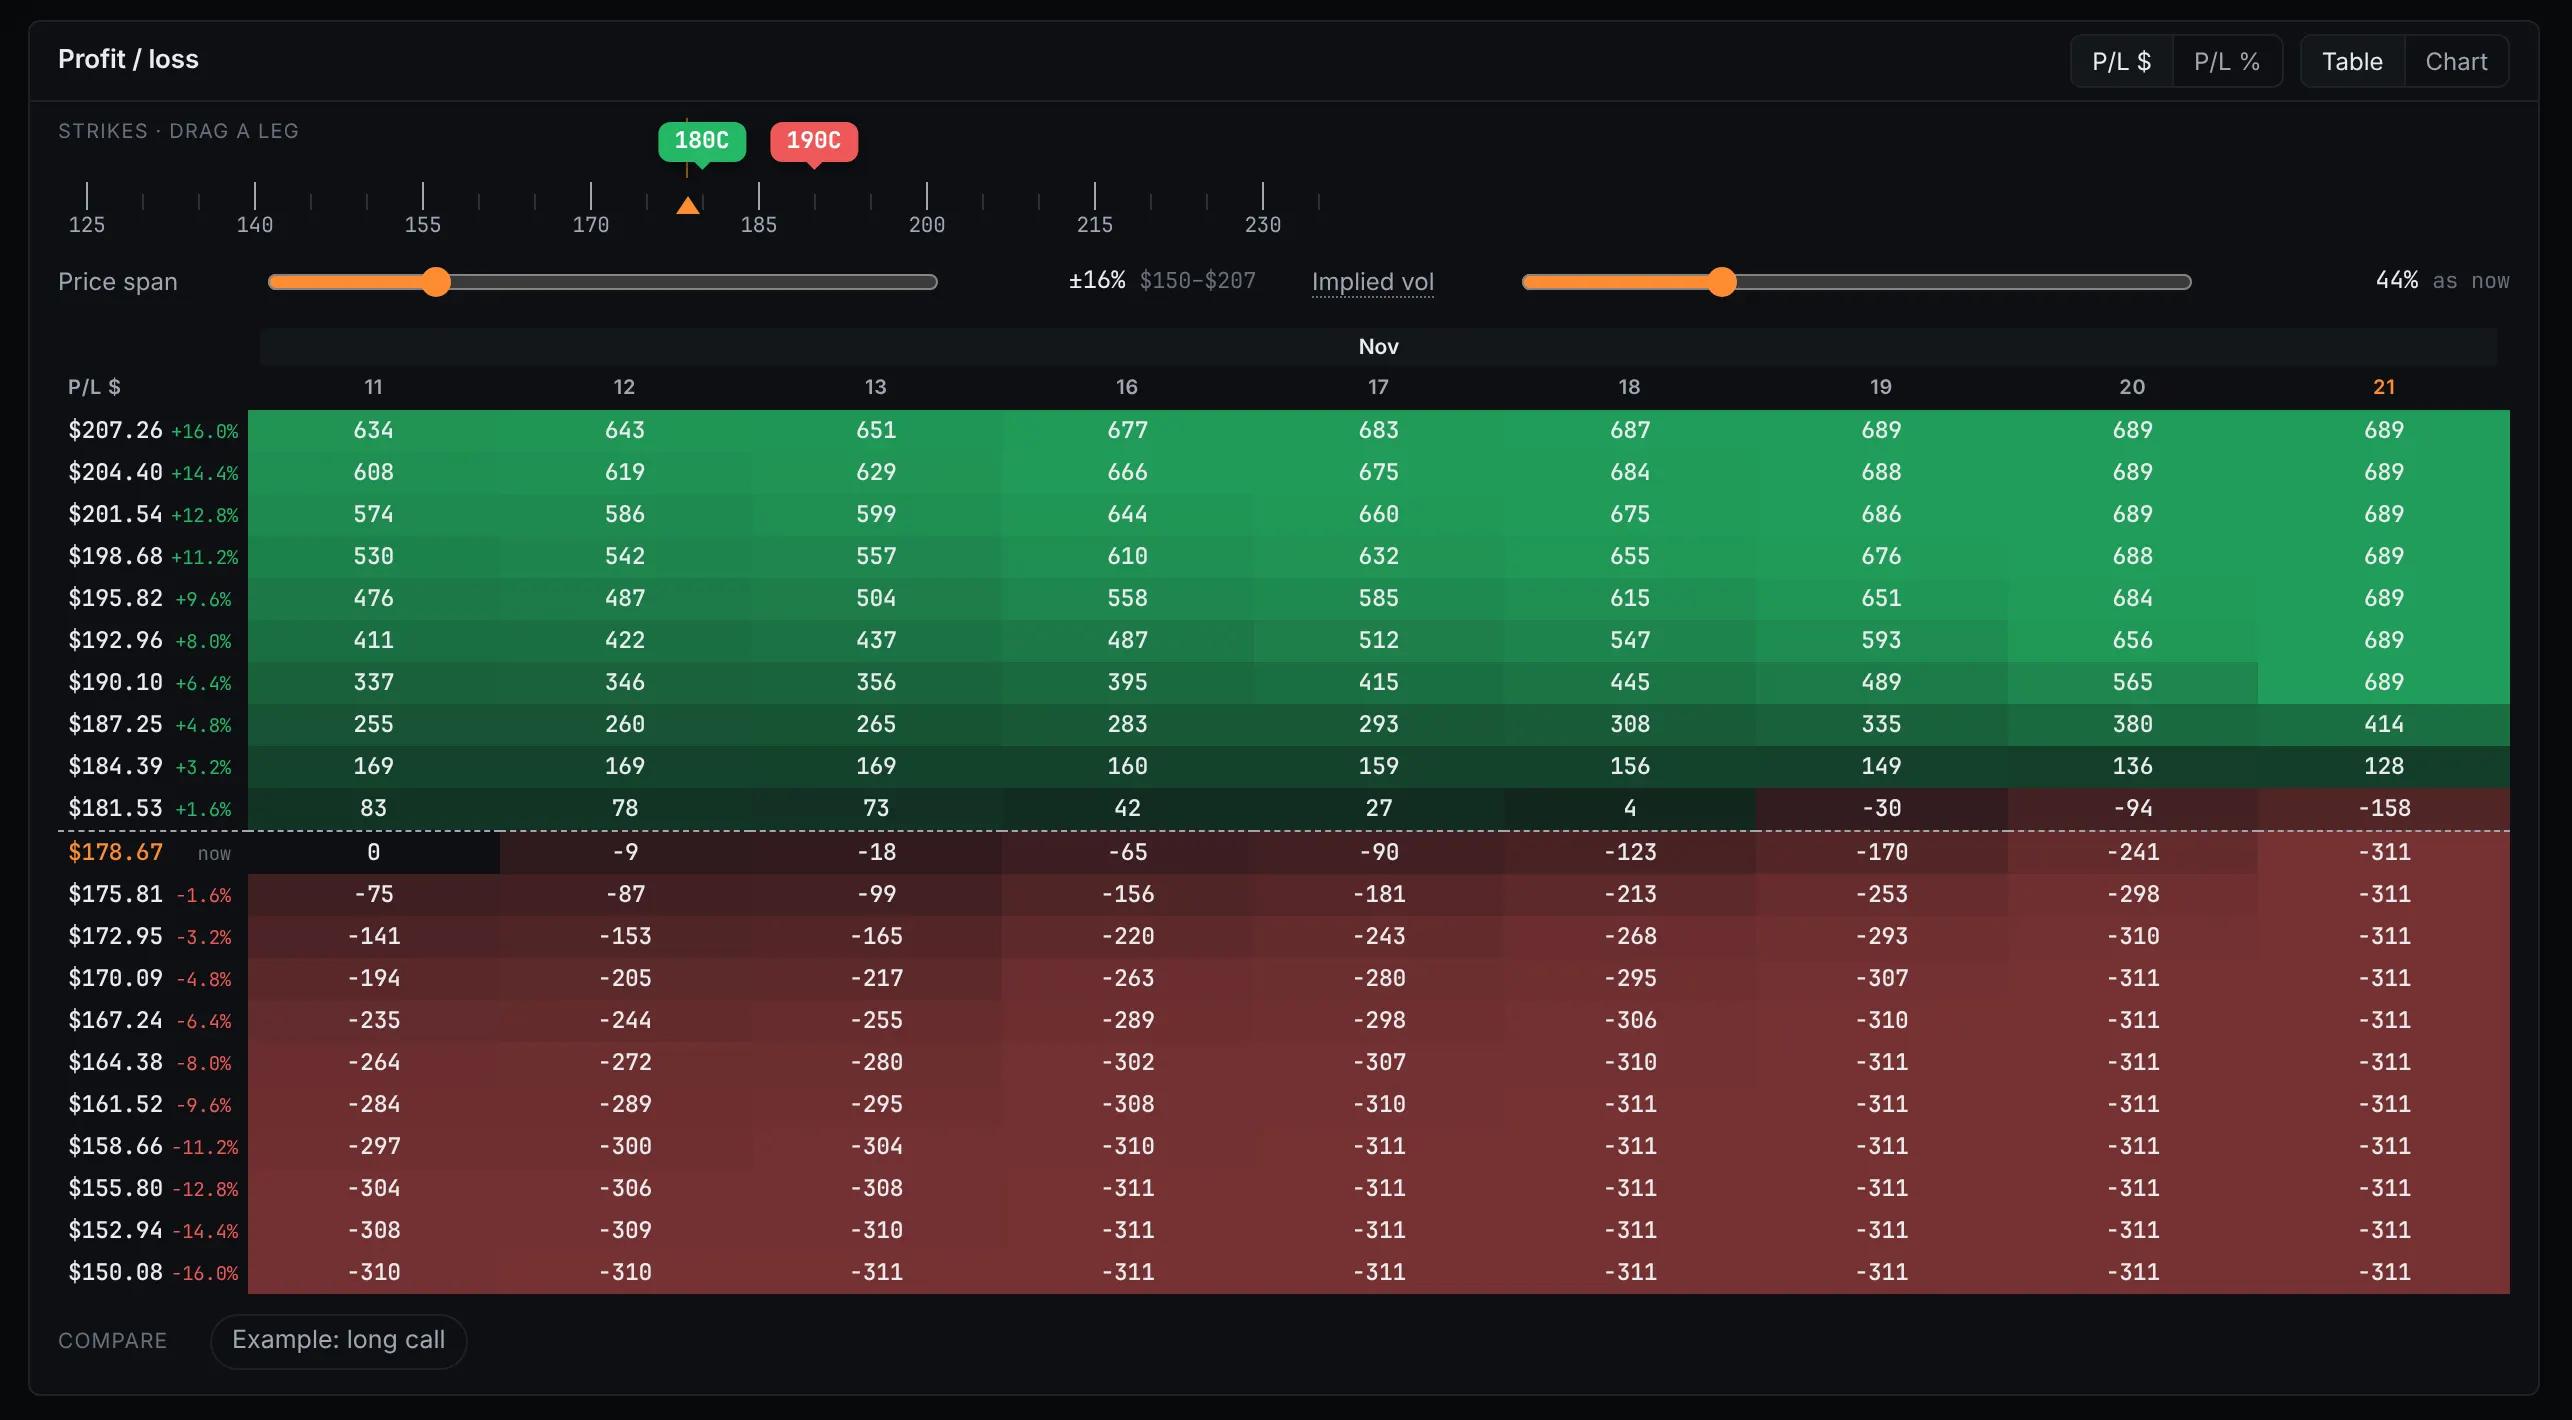
Profit or loss for every combination of stock price and date to expiration, with sliders for the price range and implied volatility.
13
Access for AI assistants
With a personal access key, an AI assistant can read the watchlist, scores, valuations, events, and news, and add or remove tickers, over MCP or a REST API.
05 Status and links
Live demoPrivate repo